|
|
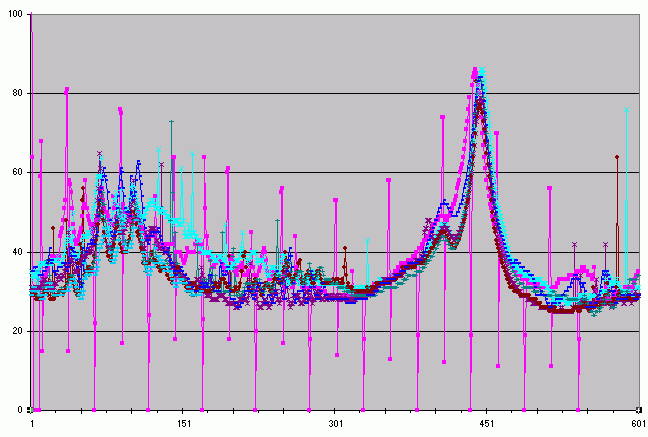
Vertical axis shows (uncalibrated) signal strength. Horizontal axis shows measurement points, not time. Each line on the graph represents one day's measurements. |
This page shows some preliminary results. Figure 1 shows a graph of the first week's results. The bump on the left is the sidelobes of the antenna picking up noise from the sun. The bump on the right is the antenna's beam crossing the Milky Way Galaxy.
| Measurement period: | One week |
| Right Ascension: | 0h to 24h |
| Declination: | 16 deg |
|
|
|
Vertical axis shows (uncalibrated) signal strength. Horizontal axis shows measurement points, not time. Each line on the graph represents one day's measurements. |